
File:Indicative probabilities of exceeding various increases in global mean temperature (relative to the pre-industrial level) for stabilization levels of 400, 450, 500, 550, 650 and 750 ppmv carbon dioxide equivalent.png
Size of this preview: 640 × 445 pixels.
| |
This is a file from the Wikimedia Commons. Information from its description page there is shown below.
Commons is a freely licensed media file repository. You can help. |
Summary
| Description |
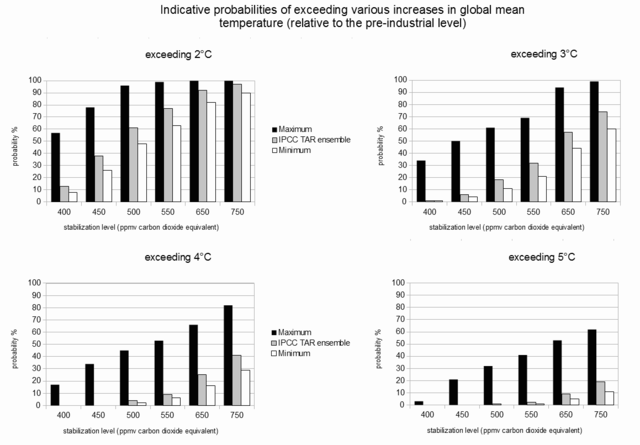
English: This image shows bar graphs giving the probabilities of exceeding various increases in global mean temperature (relative to the pre-industrial level) (Stern, 2006, p.195). Probabilities are given for different stabilization levels of greenhouse gas (GHGs) concentrations in the atmosphere (measured in carbon dioxide equivalent). In each graph, three different probabilities are given for each GHG stabilization level. The probabilities labelled "maximum" and "minimum" are based on analyses by Meinshausen (2006) (referred to by Stern, 2006, p.195). Meinshausen (2006) brought together results from eleven studies, and the "maximum" and "minimum" bars give the maximum and minimum chance of exceeding a level of temperature increase across all eleven studies. The probabilities labelled "IPCC TAR ensemble" are based on analyses by Wigley and Raper (2001) (referred to by Stern, 2006, p.195). These probabilities reflect the results of seven coupled ocean-atmosphere climate models used in the Intergovernmental Panel on Climate Change's Third Assessment Report (IPCC TAR), published in 2001. Temperature changes for each GHG stabilization level are equilibrium changes occurring on the timescale of several centuries to a millennium (US National Research Council, 2011, p.83). This means that after stabilizing atmospheric GHG concentrations, global mean temperature would continue to rise for several centuries until stabilizing. Over longer time periods, changes in the Earth system, e.g., the melting of ice sheets, could possibly lead to additional warming (Schmidt, 2008). References: Schmidt, G., 7 April 2008: RealClimate: Target CO2. RealClimate website; Stern, N., 2006: Stern Review Report on the Economics of Climate Change (pre-publication edition): Chapter 8 The challenge of stabilisation. HM Treasury, London, UK; US National Research Council, 2011: Climate Stabilization Targets: Emissions, Concentrations, and Impacts over Decades to Millennia. p.83. The National Academies Press, Washington, D.C., USA
|
| Date | 8 March 2012 |
| Source | Own work |
| Author | Enescot |
Licensing
|

File usage
The following pages on Schools Wikipedia link to this image (list may be incomplete):
Metadata
A background to Schools Wikipedia
SOS Children aims to make Wikipedia suitable for young learners. By supporting vulnerable children right through to adulthood, SOS Children makes a lasting difference to the lives of thousands of people. Education is a key part of our work, and our schools provide high-quality teaching to the children in our care. You can help by sponsoring a child.