Imagen:Hilbert transform.png
De Wikipedia, la enciclopedia libre
| | Éste es un fichero de Wikimedia Commons, un depósito de contenido libre hospedado por la Fundación Wikimedia. Más abajo se reproduce su página de descripción con la información sobre su origen y licencia. |
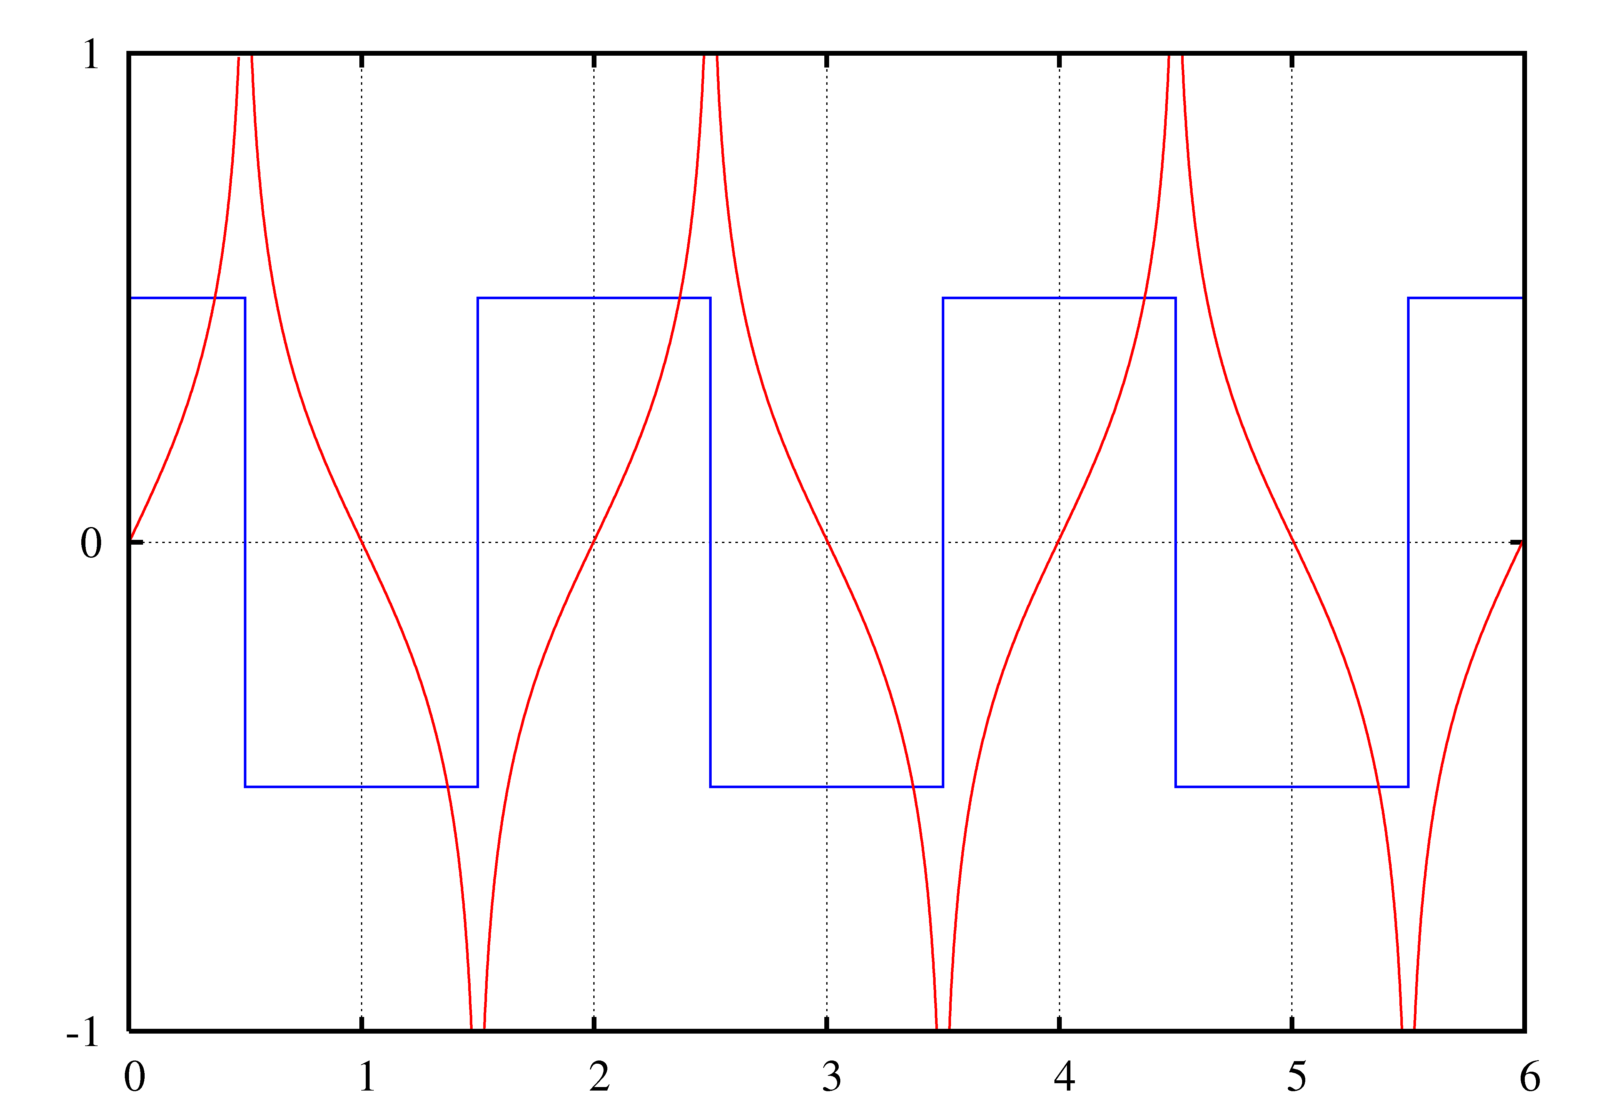
A graph of the Hilbert transform (red) of a square wave (blue).
[edit] Instructions
See Wikipedia graph-making tips.
Plotted in Maxima with the following commands:
u(t) := 1/2*(1+signum(t));
rect(t) := u(t + 1/2) - u(t - 1/2);
A train of rectangular pulses (or a square wave). This should be n=−∞..+∞, but I can't get Maxima to evaluate it, so I just chose n values that would give a close enough approximation for the visible area:
train(t) := sum(rect(t-2*n),n,-10,20);
The Hilbert transform of a rectangular pulse:
hrect(t) := log(abs((t+1/2)/(t-1/2)))/%PI;
A "train" of hrects. Again with the approximation, though this time it actually matters (rectangular function is 0 everywhere; this is not.):
htrain(t) := sum(hrect(t-2*n),n,-100,100);
The plot command:
plot2d([train(t)-0.5,htrain(t)],[t,0,6],[y,-1,1],[nticks,500], [gnuplot_preamble,"set grid; set ytics 1; set nokey"], [gnuplot_ps_term_command,"set term postscript enhanced landscape color solid lw 2 'Times-Roman' 20"], [gnuplot_term,ps], [gnuplot_out_file,"hilbert.ps"]);
This causes gnuplot to create a .ps file.
To convert the PostScript file to PNG:
- Open it in the GIMP (make sure you have ghostscript installed! - Windows instructions)
- Enter 500 under Resolution (it doesn't say "DPI" but I think that's what it means)
- Uncheck Try bounding box (since the bounding box cuts off the edge, unfortunately. You can try with the bounding box first.)
- Enter large values for Width and Height
- Check Color
- Check Strong anti-aliasing for both graphics and text
- Crop off extra whitespace (Shift+C if you can't find it in the toolbox)
- Possibly need to rotate it: Click Image → Transform → Rotate 90 degrees clockwise
Filters → Blur → Gaussian blur at 2.0 px(No need to blur if you use strong anti-aliasing during conversion. I see no significant difference between end results.)- Image → Scale Image...
- Width and Height at 25%
- Cubic interpolation
- You can view at normal size if you want by pressing 1, Ctrl+E
- Save as Hilbert transform.png
Original version of this plot was made in GNU Octave with the command:
imag(hilbert(x))
Source: Created by User:Omegatron using gnuplot, possibly with post-processing in the GIMP (PNG) or Inkscape (SVG)
|

Enlaces a la imagen
Las siguientes páginas enlazan a esta imagen:

